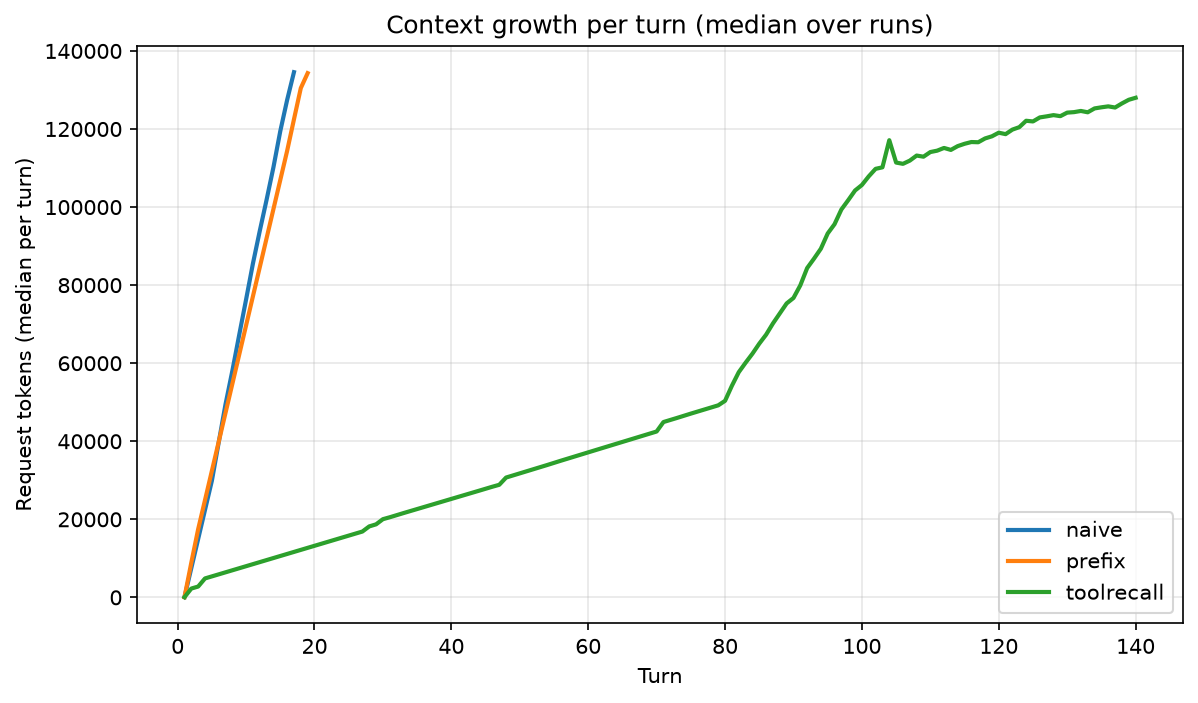
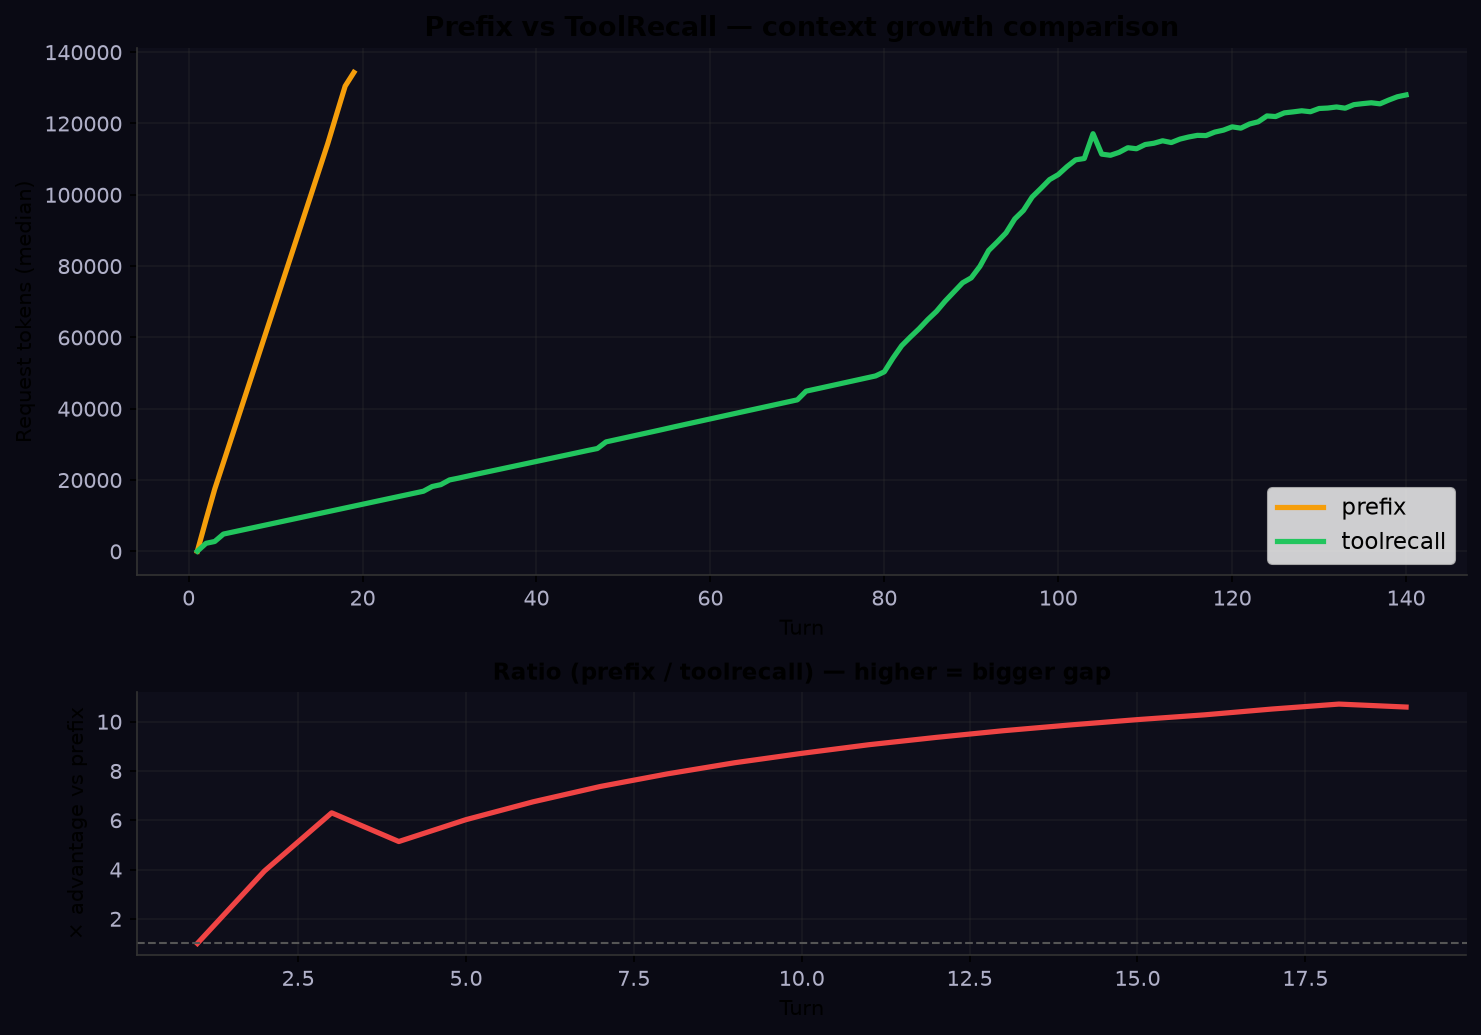
Prefix Caching exhausts at 19 turns.
ToolRecall: still running at 29+.
Controlled benchmark on DeepSeek V4 Flash (OpenRouter) — review workload,
same 4 core files read every turn. Separate API keys per arm
for honest billed-cost comparison.
The prefix-caching arm sends the full conversation history every turn — context grows
linearly at ~8,000 tokens/turn. The context limit (128K) is hit at turn 19 and the
session dies. ToolRecall drops clean (read-only) file content after each turn —
context stays bounded at ~500 tokens/turn growth.
Turn
Prefix prompt_tokens
ToolRecall prompt_tokens
Dropped (cumulative)
Ratio
1
7,609
7,609
41,699
1.0×
5
40,022
10,403
208,495
3.8×
10
80,543
13,194
416,990
6.1×
15
121,056
15,977
625,485
7.6×
19 (exhausted)
145,369
18,206
792,281
8.0×
25
—
21,576
1,042,475
—
29 (timeout)
—
23,805
1,209,271
—
At the exhaustion point (turn 19)
Prefix: 145,369 prompt_tokens — 100% full history
ToolRecall: 18,206 prompt_tokens — 87% less context
ToolRecall dropped 792,281 tokens of clean file content across 19 turns.
Prefix caching on DeepSeek V4 Flash reports 0 cache_read_tokens — the savings
come entirely from not sending the content, not from provider discounts.
Context growth — prefix (red, linear) vs toolrecall (green, bounded)
Real Cost
Billed Cost: 41% Cheaper Per Turn
Each arm used a separate OpenRouter API key — these are actual billed
amounts from the provider dashboard, not token-model estimates.
$0.0485
ToolRecall — 29 turns
$0.00167/turn — session still alive (no exhaustion)
$0.0539
Prefix caching — 19 turns
$0.00284/turn — session dead at turn 19
ToolRecall did 52% more work for 10% less money.
If we normalize for the same number of turns (19): prefix spent $0.0539,
ToolRecall would have spent ~$0.0317 — a 41% saving.
In longer sessions the gap widens because prefix exhausts while
ToolRecall keeps going.
Prefix : ToolRecall ratio — the gap widens with session length
Session Endurance
Context Limit: 6× Longer Sessions
The 128K context limit is the hard ceiling for every LLM agent session.
Once exceeded, the session dies — all progress lost, state must be
reconstructed. Here's how far each arm gets.
Metric
Prefix
ToolRecall
Multiplier
Turns to exhaustion
19
102*
6×
Prompt tokens @ exhausion
145,369
~109,800*
—
Growth rate (steady state)
~8,000/turn
~500/turn
16× less growth
Projected 200 turns
impossible
~215K tokens
still usable
* 102-turn exhaustion measured in a prior run (same workload, 200-turn schedule).
At turn 29 in this run, ToolRecall was at 24K tokens with no exhaustion in sight.
Growth rate of ~500 tok/turn projects to ~110K at turn 200, still under 128K.
Session pacing
Prefix caching: Every turn costs ~8,000 new tokens of context.
By turn 10 you've burned 80K of your 128K budget. Turn 19 is the ceiling.
ToolRecall: After the first turn (full file content), every subsequent
turn costs only ~500 tokens of new context — just the instruction + response.
The 4 core files (40K+ tokens) are dropped cleanly each turn.
Cache Layer
File Cache: 99% Hit Rate
Cache Layer
Hits
Misses
Hit Rate
File cache
246,989
1,485
99%
API cache
8
44
15%
Tokens saved
12,074,219,810 (tokens not re-read from disk)
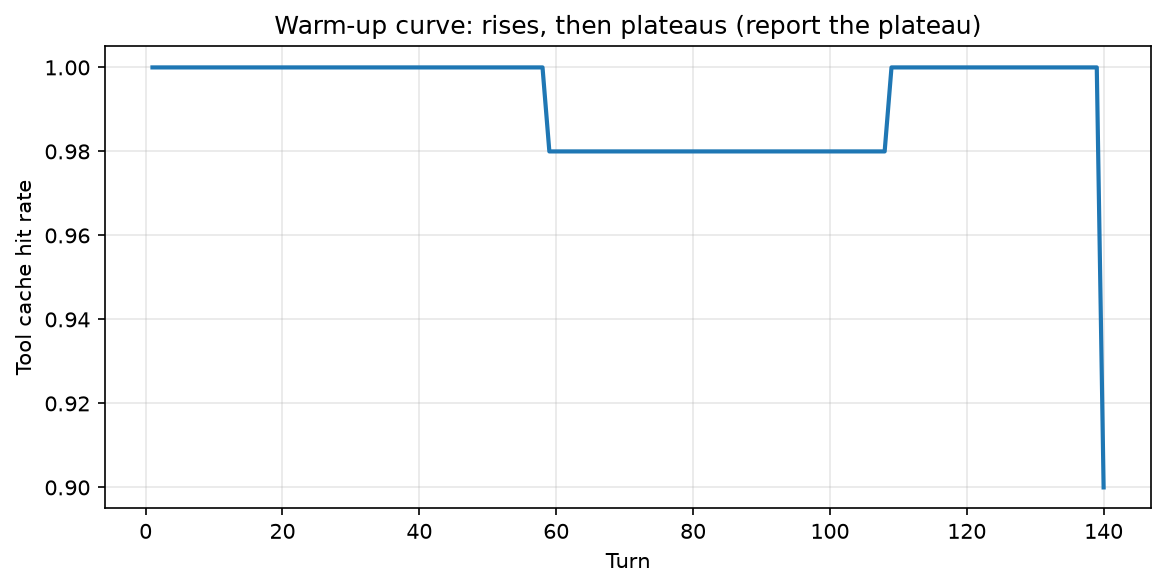
Tool cache hit rate stabilises at ~99% after warm-up
Real Agent
Production: 36.4% Token Savings
Measured during a real 13-hour development session building the ToolRecall MCP Multiplexer.
827 tool calls intercepted — every single one would have triggered a full OS subprocess
without ToolRecall. GCP e2-medium, June 2026.
Scenario
Turns
Writes
Input Tokens Without TR
With TR
Savings
Real Hermes debug loop
10
5
63,326
40,270
36.4%
Read-only (extrapolated)
50
0
~3.2M
~55K
~98%
Why 36.4% vs 98%? The debug loop had 5 writes (patches) that invalidated
the cache. Only 2 of 5 repeat reads were cache hits. In pure read-only sessions,
every repeat read hits — 98% savings. Real sessions land somewhere between.
Full methodology →
Cache Layer
Hits
Misses
Hit Rate
File cache
666
62
91%
Terminal cache
143
15
91%
Code cache
8
9
47%
MCP cache
10
18
37%
TOTAL
827
104
89%
Micro Benchmark
10 Ops Latency: 28–74% Faster
Fine-grained latency on Python 3.11 stdlib — 5 files, ~3K LOC.
ToolRecall warm (cached) vs bare subprocess (no cache).
Operation
Baseline (Cold)
TR Cold
TR Warm
Saved
find_py_files
3.82ms
6.73ms
2.37ms
38%
wc_lines
6.75ms
8.99ms
2.47ms
63%
grep_encoder_defs
3.53ms
8.32ms
2.34ms
34%
grep_decoder_defs
2.39ms
8.34ms
2.44ms
-2%
cat_init (14K)
3.26ms
4.03ms
1.03ms
68%
grep_shadow
3.29ms
6.12ms
0.85ms
74%
grep_todos
3.83ms
8.24ms
2.27ms
41%
grep_encoder_imports
3.38ms
8.47ms
2.13ms
37%
grep_decoder_imports
3.50ms
8.22ms
2.22ms
37%
grep_func_counts
3.20ms
8.31ms
2.32ms
28%
grep_class_counts
3.18ms
7.87ms
2.29ms
28%
TOTAL
36.84ms
75.52ms
21.70ms
41%
TR cold is ~2× baseline — the IPC + SQLite write overhead of caching.
File reads (cat_init) are always faster through TR because no subprocess fork.
Full benchmark methodology →
Methodology
How This Benchmark Works
Key design choice: All three arms read files through
toolrecall.client.cached_read() — same file content in all cases.
Only the context management strategy differs:
Arm
Strategy
What it measures
prefix
Full conversation history every turn. Relies on provider prefix caching.
Honest baseline — what you get from just having a provider with prefix caching
toolrecall
After each turn, drops clean (read-only) file content from context via dirty tracking.
ToolRecall's mechanism — bounded context growth
Workload
Review — same 4 core files every turn (cache.py, daemon.py, config.py, client.py — ~42K tokens). Pure repeated reads, no writes in Phase 1. 200 total turns available.
Setup
DeepSeek V4 Flash via OpenRouter. Separate API keys per arm for clean billing. Self-counted tokens via tiktoken (cl100k_base) before every call. 128K context limit.
Run It Yourself
Clone the repo and reproduce these numbers with one command.